A pivot chart is an Excel chart report based on the data of a pivot table. Similar to a chart in Excel, a pivot chart can have two positions: as a distinct sheet or as an object in a sheet.
EasyXLS™ library allows you to create a pivot chart in Excel and attach a pivot table to it as data source.
All the features presented for charts are available also for pivot charts.
// Create an instance of the class that exports Excel files, having two sheets
ExcelDocument workbook = new ExcelDocument(2);

// Set the sheet names
workbook.easy_getSheetAt(0).setSheetName("First tab");
workbook.easy_getSheetAt(1).setSheetName("Second tab");

// Add data to the first sheet, the data source of the pivot table
...

// Create pivot table
ExcelPivotTable xlsPivotTable = new ExcelPivotTable();
xlsPivotTable.setName("Sales");
xlsPivotTable.setSourceRange("First tab!$A$1:$E$9", workbook);
xlsPivotTable.setLocation("A3:G15");
xlsPivotTable.addFieldToRowLabels("Sale agent");
xlsPivotTable.addFieldToColumnLabels("Year");
xlsPivotTable.addFieldToValues("Sale amount", "Sale amount per year",
        PivotTable.SUBTOTAL_SUM);
xlsPivotTable.addFieldToReportFilter("Sale country");
xlsPivotTable.setOutlineForm();
xlsPivotTable.setStyle(PivotTable.PIVOT_STYLE_MEDIUM_9);

// Add the pivot table to the second sheet
((ExcelWorksheet)workbook.easy_getSheet(
        "Second tab")).easy_addPivotTable(xlsPivotTable);

// Create a pivot chart
ExcelPivotChart xlsPivotChart = new ExcelPivotChart();
xlsPivotChart.setSize(600, 300);
xlsPivotChart.setLeftUpperCorner("A10");
xlsPivotChart.easy_setChartType(Chart.CHART_TYPE_PYRAMID_BAR);
xlsPivotChart.getChartTitle().setText("Sales");
xlsPivotChart.setPivotTable(xlsPivotTable);

// Add the pivot chart to the second sheet
((ExcelWorksheet)workbook.easy_getSheet(
        "Second tab")).easy_addPivotChart(xlsPivotChart);

// Export Excel file
workbook.easy_WriteXLSXFile("C:\\Samples\\Excel pivot chart.xlsx");
' Create an instance of the class that exports Excel files, having two sheetsDim workbook As New ExcelDocument(2)
' Set the sheet names
workbook.easy_getSheetAt(0).setSheetName("First tab")
workbook.easy_getSheetAt(1).setSheetName("Second tab")
' Add data to the first sheet, the data source of the pivot table
...
' Create pivot tableDim xlsPivotTable As New ExcelPivotTable
xlsPivotTable.setName("Sales")
xlsPivotTable.setSourceRange("First tab!$A$1:$E$9", workbook)
xlsPivotTable.setLocation("A3:G15")
xlsPivotTable.addFieldToRowLabels("Sale agent")
xlsPivotTable.addFieldToColumnLabels("Year")
xlsPivotTable.addFieldToValues("Sale amount", "Sale amount per year", _
PivotTable.SUBTOTAL_SUM)
xlsPivotTable.addFieldToReportFilter("Sale country")
xlsPivotTable.setOutlineForm()
xlsPivotTable.setStyle(PivotTable.PIVOT_STYLE_MEDIUM_9)
' Add the pivot table to the second sheetDim xlsWorksheet As ExcelWorksheet = workbook.easy_getSheet("Second tab")
xlsWorksheet.easy_addPivotTable(xlsPivotTable)
' Create a pivot chartDim xlsPivotChart As ExcelPivotChart = New ExcelPivotChart
xlsPivotChart.setSize(600, 300)
xlsPivotChart.setLeftUpperCorner("A10")
xlsPivotChart.easy_setChartType(Chart.CHART_TYPE_PYRAMID_BAR)
xlsPivotChart.getChartTitle().setText("Sales")
xlsPivotChart.setPivotTable(xlsPivotTable)
' Add the pivot chart to the worksheet
xlsWorksheet.easy_addPivotChart(xlsPivotChart)
' Export Excel file
workbook.easy_WriteXLSXFile("C:\Samples\Excel pivot chart.xlsx")
C++// Create an instance of the class that exports Excel files
EasyXLS::IExcelDocumentPtr workbook;
hr = CoCreateInstance(__uuidof(EasyXLS::ExcelDocument),
NULL,
CLSCTX_ALL,
__uuidof(EasyXLS::IExcelDocument),
(void**) &workbook) ;
// Create two sheets
workbook->easy_addWorksheet_2("First tab");
workbook->easy_addWorksheet_2("Second tab");
// Add data to the first sheet, the data source of the pivot table
...
// Create pivot table
EasyXLS::IPivotTablePtr xlsPivotTable;
hr = CoCreateInstance(__uuidof(EasyXLS::ExcelPivotTable),
NULL,
CLSCTX_ALL,
__uuidof(EasyXLS::IExcelPivotTable),
(void**) &xlsPivotTable) ;
xlsPivotTable->setName("Sales");
xlsPivotTable->setSourceRange("First tab!$A$1:$E$9",_variant_t((IDispatch*) workbook));
xlsPivotTable->setLocation_2("A3:G15");
xlsPivotTable->addFieldToRowLabels("Sale agent");
xlsPivotTable->addFieldToColumnLabels("Year");
xlsPivotTable->addFieldToValues("Sale amount", "Sale amount per year",
PIVOTTABLE_SUBTOTAL_SUM);
xlsPivotTable->addFieldToReportFilter("Sale country");
xlsPivotTable->setOutlineForm();
xlsPivotTable->setStyle(PIVOTTABLE_PIVOT_STYLE_MEDIUM_9);
// Add the pivot table to the second sheet
EasyXLS::IExcelWorksheetPtr xlsWorksheet =
(EasyXLS::IExcelWorksheetPtr)workbook->easy_getSheet("Second tab");
xlsWorksheet->easy_addPivotTable(xlsPivotTable);
// Create a pivot chart
EasyXLS::IExcelPivotChartPtr xlsPivotChart;
hr = CoCreateInstance(__uuidof(EasyXLS::ExcelPivotChart),
NULL,
CLSCTX_ALL,
__uuidof(EasyXLS::IExcelPivotChart),
(void**) &xlsPivotChart);
xlsPivotChart->setSize(600, 300);
xlsPivotChart->setLeftUpperCorner_2("A10");
xlsPivotChart->easy_setChartType(CHART_CHART_TYPE_PYRAMID_BAR);
xlsPivotChart->getChartTitle()->setText("Sales");
xlsPivotChart->setPivotTable(xlsPivotTable);
// Add the pivot chart to the worksheet
xlsWorksheet->easy_addPivotChart(xlsPivotChart);
// Export Excel file
workbook->easy_WriteXLSXFile("C:\\Samples\\Excel pivot chart.xlsx");
Click here to see Continuous Code ListingC++.NET// Create an instance of the class that exports Excel files, having two sheets
ExcelDocument ^workbook = gcnew ExcelDocument(2);
// Set the sheet names
workbook->easy_getSheetAt(0)->setSheetName("First tab");
workbook->easy_getSheetAt(1)->setSheetName("Second tab");
// Add data to the first sheet, the data source of the pivot table
...
// Create pivot table
ExcelPivotTable ^xlsPivotTable = gcnew ExcelPivotTable();
xlsPivotTable->setName("Sales");
xlsPivotTable->setSourceRange("First tab!$A$1:$E$9", workbook);
xlsPivotTable->setLocation("A3:G15");
xlsPivotTable->addFieldToRowLabels("Sale agent");
xlsPivotTable->addFieldToColumnLabels("Year");
xlsPivotTable->addFieldToValues("Sale amount", "Sale amount per year",
PivotTable::SUBTOTAL_SUM);
xlsPivotTable->addFieldToReportFilter("Sale country");
xlsPivotTable->setOutlineForm();
xlsPivotTable->setStyle(PivotTable::PIVOT_STYLE_MEDIUM_9);
// Add the pivot table to the second sheet
ExcelWorksheet ^xlsWorksheet = safe_cast<ExcelWorksheet^>(workbook->easy_getSheet("Second tab"));
xlsWorksheet->easy_addPivotTable(xlsPivotTable);
// Create a pivot chart
ExcelPivotChart ^xlsPivotChart = gcnew ExcelPivotChart();
xlsPivotChart->setSize(600, 300);
xlsPivotChart->setLeftUpperCorner("A10");
xlsPivotChart->easy_setChartType(Chart::CHART_TYPE_PYRAMID_BAR);
xlsPivotChart->getChartTitle()->setText("Sales");
xlsPivotChart->setPivotTable(xlsPivotTable);
// Add the pivot chart to the worksheet
xlsWorksheet->easy_addPivotChart(xlsPivotChart);
// Export Excel file
workbook->easy_WriteXLSXFile("C:\\Samples\\Excel pivot chart.xlsx");
Click here to see Continuous Code Listing
// Create an instance of the class that exports Excel files, having two sheets
ExcelDocument workbook = new ExcelDocument(2);

// Set the sheet names
workbook.easy_getSheetAt(0).setSheetName("First tab");
workbook.easy_getSheetAt(1).setSheetName("Second tab");

// Add data to the first sheet, the data source of the pivot table
...

// Create pivot table
ExcelPivotTable xlsPivotTable = new ExcelPivotTable();
xlsPivotTable.setName("Sales");
xlsPivotTable.setSourceRange("First tab!$A$1:$E$9", workbook);
xlsPivotTable.setLocation("A3:G15");
xlsPivotTable.addFieldToRowLabels("Sale agent");
xlsPivotTable.addFieldToColumnLabels("Year");
xlsPivotTable.addFieldToValues("Sale amount", "Sale amount per year",
        PivotTable.SUBTOTAL_SUM);
xlsPivotTable.addFieldToReportFilter("Sale country");
xlsPivotTable.setOutlineForm();
xlsPivotTable.setStyle(PivotTable.PIVOT_STYLE_MEDIUM_9);

// Add the pivot table to the second sheet
((ExcelWorksheet)workbook.easy_getSheet(
        "Second tab")).easy_addPivotTable(xlsPivotTable);

// Create a pivot chart
ExcelPivotChart xlsPivotChart = new ExcelPivotChart();
xlsPivotChart.setSize(600, 300);
xlsPivotChart.setLeftUpperCorner("A10");
xlsPivotChart.easy_setChartType(Chart.CHART_TYPE_PYRAMID_BAR);
xlsPivotChart.getChartTitle().setText("Sales");
xlsPivotChart.setPivotTable(xlsPivotTable);

// Add the pivot chart to the second sheet
((ExcelWorksheet)workbook.easy_getSheet(
        "Second tab")).easy_addPivotChart(xlsPivotChart);

// Export Excel file
workbook.easy_WriteXLSXFile("C:\\Samples\\Excel pivot chart.xlsx");
COM+:// Create an instance of the class that exports Excel files
$workbook = new COM("EasyXLS.ExcelDocument");
// Create two sheets
$workbook->easy_addWorksheet_2("First tab");
$workbook->easy_addWorksheet_2("Second tab");
// Add data to the first sheet, the data source of the pivot table
...
// Create pivot table
$xlsPivotTable = new COM("EasyXLS.PivotTables.ExcelPivotTable");
$xlsPivotTable->setName("Sales");
$xlsPivotTable->setSourceRange("First tab!\$A\$1:\$E\$9", $workbook);
$xlsPivotTable->setLocation_2("A3:G15");
$xlsPivotTable->addFieldToRowLabels("Sale agent");
$xlsPivotTable->addFieldToColumnLabels("Year");
$xlsPivotTable->addFieldToValues("Sale amount", "Sale amount per year",
$PIVOTTABLE_SUBTOTAL_SUM);
$xlsPivotTable->addFieldToReportFilter("Sale country");
$xlsPivotTable->setOutlineForm();
$xlsPivotTable->setStyle($PIVOTTABLE_PIVOT_STYLE_MEDIUM_9);
// Add the pivot table to the second sheet
$xlsWorksheet = $workbook->easy_getSheet("Second tab");
$xlsWorksheet->easy_addPivotTable($xlsPivotTable);
// Create a pivot chart
$xlsPivotChart = new COM("EasyXLS.PivotTables.ExcelPivotChart");
$xlsPivotChart->setSize(600, 300);
$xlsPivotChart->setLeftUpperCorner_2("A10");
$xlsPivotChart->easy_setChartType($CHART_CHART_TYPE_PYRAMID_BAR);
$xlsPivotChart->getChartTitle()->setText("Sales");
$xlsPivotChart->setPivotTable($xlsPivotTable);
// Add the pivot chart to the worksheet
$xlsWorksheet->easy_addPivotChart($xlsPivotChart);
// Export Excel file
$workbook->easy_WriteXLSXFile("C:\Samples\Excel pivot chart.xlsx");
Click here to see Continuous Code ListingJava:// Create an instance of the class that exports Excel files
$workbook = new java("EasyXLS.ExcelDocument");
// Create two worksheets
$workbook->easy_addWorksheet("First tab");
$workbook->easy_addWorksheet("Second tab");
// Add data to the first sheet, the data source of the pivot table
...
// Create pivot table
$xlsPivotTable = new java("EasyXLS.PivotTables.ExcelPivotTable");
$xlsPivotTable->setName("Sales");
$xlsPivotTable->setSourceRange("First tab!\$A\$1:\$E\$9", $workbook);
$xlsPivotTable->setLocation("A3:G15");
$xlsPivotTable->addFieldToRowLabels("Sale agent");
$xlsPivotTable->addFieldToColumnLabels("Year");
$xlsPivotTable->addFieldToValues("Sale amount","Sale amount per year",
$PIVOTTABLE_SUBTOTAL_SUM);
$xlsPivotTable->addFieldToReportFilter("Sale country");
$xlsPivotTable->setOutlineForm();
$xlsPivotTable->setStyle($PIVOTTABLE_PIVOT_STYLE_MEDIUM_9);
// Add the pivot table to the second sheet
$xlsWorksheet = $workbook->easy_getSheet("Second tab");
$xlsWorksheet->easy_addPivotTable($xlsPivotTable);
// Create pivot chart
$xlsPivotChart1 = new java("EasyXLS.PivotTables.ExcelPivotChart");
$xlsPivotChart1->setSize(600, 300);
$xlsPivotChart1->setLeftUpperCorner("A10");
$xlsPivotChart1->easy_setChartType($CHART_CHART_TYPE_PYRAMID_BAR);
$xlsPivotChart1->getChartTitle()->setText("Sales");
$xlsPivotChart1->setPivotTable($xlsPivotTable);
// Add the pivot chart to the second sheet
$xlsWorksheet->easy_addPivotChart($xlsPivotChart1);
// Export Excel file
$workbook->easy_WriteXLSXFile("C:\Samples\Excel pivot chart.xlsx");
Click here to see Continuous Code Listing
' Create an instance of the class that exports Excel filesset workbook = Server.CreateObject("EasyXLS.ExcelDocument")
' Create two sheets
workbook.easy_addWorksheet_2("First tab")
workbook.easy_addWorksheet_2("Second tab")
' Add data to the first sheet, the data source of the pivot table
...
' Create pivot tableset xlsPivotTable = Server.CreateObject("EasyXLS.PivotTables.ExcelPivotTable")
xlsPivotTable.setName("Sales")
xlsPivotTable.setSourceRange"First tab!$A$1:$E$9",workbook
xlsPivotTable.setLocation_2("A3:G15")
xlsPivotTable.addFieldToRowLabels("Sale agent")
xlsPivotTable.addFieldToColumnLabels("Year")
xlsPivotTable.addFieldToValues("Sale amount", "Sale amount per year", _
PivotTable.SUBTOTAL_SUM)
xlsPivotTable.addFieldToReportFilter("Sale country")
xlsPivotTable.setOutlineForm()
xlsPivotTable.setStyle(PivotTable.PIVOTTABLE_PIVOT_STYLE_MEDIUM_9)
' Add the pivot table to the second sheetset xlsWorksheet = workbook.easy_getSheet("Second tab")
xlsWorksheet.easy_addPivotTable(xlsPivotTable)
' Create a pivot chartset xlsPivotChart = Server.CreateObject("EasyXLS.PivotTables.ExcelPivotChart")
xlsPivotChart.setSize 600, 300
xlsPivotChart.setLeftUpperCorner_2("A10")
xlsPivotChart.easy_setChartType(CHART_CHART_TYPE_PYRAMID_BAR)
xlsPivotChart.getChartTitle().setText("Sales")
xlsPivotChart.setPivotTable(xlsPivotTable)
' Add the pivot chart to the worksheet
xlsWorksheet.easy_addPivotChart(xlsPivotChart)
' Export Excel file
workbook.easy_WriteXLSXFile ("C:\Samples\Excel pivot chart.xlsx")
' Create an instance of the class that exports Excel filesSet workbook = CreateObject("EasyXLS.ExcelDocument")
' Create two sheets
workbook.easy_addWorksheet_2("First tab")
workbook.easy_addWorksheet_2("Second tab")
' Add data to the first sheet, the data source of the pivot table
...
' Create pivot tableSet xlsPivotTable = CreateObject("EasyXLS.PivotTables.ExcelPivotTable")
xlsPivotTable.setName("Sales")
xlsPivotTable.setSourceRange"First tab!$A$1:$E$9",workbook
xlsPivotTable.setLocation_2("A3:G15")
xlsPivotTable.addFieldToRowLabels("Sale agent")
xlsPivotTable.addFieldToColumnLabels("Year")
xlsPivotTable.addFieldToValues "Sale amount", "Sale amount per year", _
PIVOTTABLE_SUBTOTAL_SUM
xlsPivotTable.addFieldToReportFilter("Sale country")
xlsPivotTable.setOutlineForm()
xlsPivotTable.setStyle(PIVOTTABLE_PIVOT_STYLE_MEDIUM_9)
' Add the pivot table to the second sheetSet xlsWorksheet = workbook.easy_getSheet("Second tab")
xlsWorksheet.easy_addPivotTable(xlsPivotTable)
' Create a pivot chartset xlsPivotChart = CreateObject("EasyXLS.PivotTables.ExcelPivotChart")
xlsPivotChart.setSize 600, 300
xlsPivotChart.setLeftUpperCorner_2("A10")
xlsPivotChart.easy_setChartType(CHART_CHART_TYPE_PYRAMID_BAR)
xlsPivotChart.getChartTitle().setText("Sales")
xlsPivotChart.setPivotTable(xlsPivotTable)
' Add the pivot chart to the worksheet
xlsWorksheet.easy_addPivotChart(xlsPivotChart)
' Export Excel file
workbook.easy_WriteXLSXFile ("C:\Samples\Excel pivot chart.xlsx")
<!-- Create an instance of the class that exports Excel files --><cfobject type="java"class="EasyXLS.ExcelDocument"name="workbook"action="CREATE"><!-- Create two sheets --><cfset ret = workbook.easy_addWorksheet("First tab")><cfset ret = workbook.easy_addWorksheet("Second tab")><!-- Add data to the first sheet, the data source of the pivot table -->
...
<!-- Create pivot table --><cfobject type="java"class="EasyXLS.PivotTables.ExcelPivotTable"name="xlsPivotTable"action="CREATE"><cfset xlsPivotTable.setName("Sales")><cfset xlsPivotTable.setSourceRange("First tab!$A$1:$E$9",workbook)><cfset xlsPivotTable.setLocation("A3:G15")><cfset xlsPivotTable.ddFieldToRowLabels("Sale agent")><cfset xlsPivotTable.addFieldToColumnLabels("Year")><cfset xlsPivotTable.addFieldToValues("Sale amount", "Sale amount per year",
PivotTable.SUBTOTAL_SUM)><cfset xlsPivotTable.addFieldToReportFilter("Sale country")><cfset xlsPivotTable.setOutlineForm()><cfset xlsPivotTable.setStyle(PivotTable.PIVOT_STYLE_MEDIUM_9)><!-- Add the pivot table to the second sheet --><cfset xlsWorksheet = workbook.easy_getSheet("Second tab")><cfset xlsWorksheet.easy_addPivotTable(xlsPivotTable)><!-- Create a pivot chart --><cfobject type="java"class="EasyXLS.PivotTables.ExcelPivotChart"name="xlsPivotChart"action="CREATE"><cfset xlsPivotChart.setSize(600,300)><cfset xlsPivotChart.setLeftUpperCorner("A10")><cfset xlsPivotChart.easy_setChartType(Chart.CHART_TYPE_PYRAMID_BAR)><cfset xlsPivotChart.getChartTitle().setText("Sales")><cfset xlsPivotChart.setPivotTable(xlsPivotTable)><!-- Add the pivot chart to the second sheet --><cfset xlsWorksheet = workbook.easy_getSheet("Second tab")><cfset xlsWorksheet.easy_addPivotChart(xlsPivotChart)><!--Export Excel file --><cfset ret = workbook.easy_WriteXLSXFile("C:\Samples\Excel pivot chart.xlsx")>
.NET:# Create an instance of the class that exports Excel files, having two sheets
workbook = ExcelDocument(2, 1)
# Set the sheet names
workbook.easy_getSheetAt(0).setSheetName("First tab")
workbook.easy_getSheetAt(1).setSheetName("Second tab")
# Add data to the first sheet, the data source of the pivot table
...
# Create pivot table
xlsPivotTable = ExcelPivotTable()
xlsPivotTable.setName("Sales")
xlsPivotTable.setSourceRange("First tab!$A$1:$E$9", workbook)
xlsPivotTable.setLocation("A3:G15")
xlsPivotTable.addFieldToRowLabels("Sale agent")
xlsPivotTable.addFieldToColumnLabels("Year")
xlsPivotTable.addFieldToValues("Sale amount","Sale amount per year", PivotTable.SUBTOTAL_SUM)
xlsPivotTable.addFieldToReportFilter("Sale country")
xlsPivotTable.setOutlineForm()
xlsPivotTable.setStyle(PivotTable.PIVOT_STYLE_MEDIUM_9)
# Add the pivot table to the second sheet
workbook.easy_getSheet("Second tab").easy_addPivotTable(xlsPivotTable)
# Create pivot chart
xlsPivotChart1 = ExcelPivotChart()
xlsPivotChart1.setSize(600, 300)
xlsPivotChart1.setLeftUpperCorner("A10")
xlsPivotChart1.easy_setChartType(Chart.CHART_TYPE_PYRAMID_BAR)
xlsPivotChart1.getChartTitle().setText("Sales")
xlsPivotChart1.setPivotTable(xlsPivotTable)
# Add the pivot chart to the second sheet
workbook.easy_getSheet("Second tab").easy_addPivotChart(xlsPivotChart1)
# Export Excel file
workbook.easy_WriteXLSXFile("C:\\Samples\\Excel pivot chart.xlsx")
Click here to see Continuous Code ListingJava:# Create an instance of the class that exports Excel files, having two sheets
workbook = gateway.jvm.ExcelDocument(2, 1)
# Set the sheet names
workbook.easy_getSheetAt(0).setSheetName("First tab")
workbook.easy_getSheetAt(1).setSheetName("Second tab")
# Add data to the first sheet, the data source of the pivot table
...
# Create pivot table
xlsPivotTable = gateway.jvm.ExcelPivotTable()
xlsPivotTable.setName("Sales")
xlsPivotTable.setSourceRange("First tab!$A$1:$E$9", workbook)
xlsPivotTable.setLocation("A3:G15")
xlsPivotTable.addFieldToRowLabels("Sale agent")
xlsPivotTable.addFieldToColumnLabels("Year")
xlsPivotTable.addFieldToValues("Sale amount","Sale amount per year", gateway.jvm.PivotTable.SUBTOTAL_SUM)
xlsPivotTable.addFieldToReportFilter("Sale country")
xlsPivotTable.setOutlineForm()
xlsPivotTable.setStyle(gateway.jvm.PivotTable.PIVOT_STYLE_MEDIUM_9)
# Add the pivot table to the second sheet
workbook.easy_getSheet("Second tab").easy_addPivotTable(xlsPivotTable)
# Create pivot chart
xlsPivotChart1 = gateway.jvm.ExcelPivotChart()
xlsPivotChart1.setSize(600, 300)
xlsPivotChart1.setLeftUpperCorner("A10")
xlsPivotChart1.easy_setChartType(gateway.jvm.Chart.CHART_TYPE_PYRAMID_BAR)
xlsPivotChart1.getChartTitle().setText("Sales")
xlsPivotChart1.setPivotTable(xlsPivotTable)
# Add the pivot chart to the second sheet
workbook.easy_getSheet("Second tab").easy_addPivotChart(xlsPivotChart1)
# Export Excel file
workbook.easy_WriteXLSXFile("C:\\Samples\\Excel pivot chart.xlsx")
Click here to see Continuous Code Listing
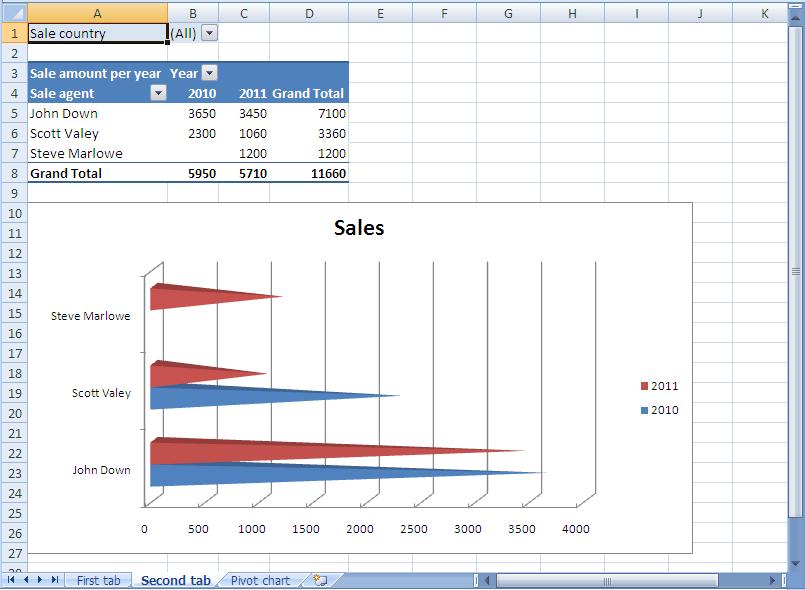
The screen shot provides an example of an exported pivot chart report to Excel.
Pivot chart data source
The data source of the pivot chart is relative to the data source of a pivot table.
EasyXLS™ library provides a large number of chart types, such as column chart, bar chart, line chart, pie chart, scatter chart, area chart, doughnut chart, radar chart, surface chart, bubble chart, stock chart, cylinder chart, cone chart and pyramid chart.
EasyXLS™ allows you to format the chart elements such as chart area, plot area, category X axis, value Y axis, gridlines, data table, legend, titles and 3D rotation.