To download the trial version of EasyXLS Excel Library, press the below button:
If you already own a license key, you may login and download EasyXLS from your account.
Install the downloaded EasyXLS installer for v8.6 or earlier.
Step 2: License file setup
Step required for EasyXLS v9.0 or later.
If you are using a trial, generate a trial license file from EasyXLS trials page. The trial license is valid for 30-days.
If you own a license key, you may login to the account that purchased the license and generate the license file from: https://www.easyxls.com/my-orders
Setup the license file into your project using these guidelines.
Step 3: Create a C# project
If don't have a project, create one as ASP.NET web application, windows forms app, console application, class library or service.
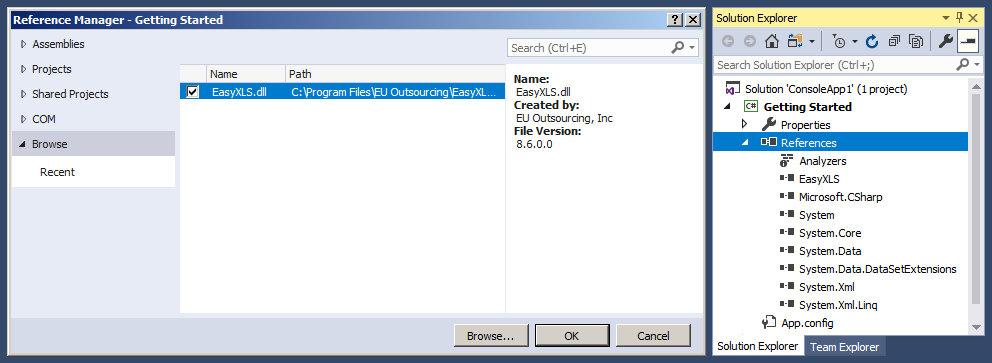
Step 4: Include EasyXLS library into project
EasyXLS.dll must be added as reference to your project. EasyXLS.dll can be found: - Inside the downloaded archive at Step 1 for EasyXLS v9.0 or later - Under installation path for EasyXLS v8.6 or earlier, in "Dot NET version" folder.
Step 5: Run C# code that sets various chart properties in Excel file
Execute the following C# code that creates a cylinder column chart and format the chart area, plot area, chart legend, axis and chart series.
/* -------------------------------------------------------------
* Tutorial 23
*
* This tutorial shows how to create an Excel file in C# with a
* chart and how to set chart type and formatting properties for
* chart area, plot area, axis, series and legend.
* ------------------------------------------------------------- */using System;
using System.Drawing;
using EasyXLS;
using EasyXLS.Constants;
using EasyXLS.Charts;
using EasyXLS.Drawings.Formatting;
public class Tutorial23
{
[STAThread]
static void Main()
{
Console.WriteLine("Tutorial 23\n-----------\n");
// Create an instance of the class that exports Excel files
ExcelDocument workbook = new ExcelDocument();
// Create an worksheet
workbook.easy_addWorksheet("SourceData");
// Get the table of data for the worksheet
ExcelTable xlsTable1 = ((ExcelWorksheet)workbook.easy_getSheet("SourceData")).easy_getExcelTable();
// Add data in cells for report header
xlsTable1.easy_getCell(0, 0).setValue("Show Date");
xlsTable1.easy_getCell(0, 1).setValue("Available Places");
xlsTable1.easy_getCell(0, 2).setValue("Available Tickets");
xlsTable1.easy_getCell(0, 3).setValue("Sold Tickets");
// Add data in cells for chart report values
xlsTable1.easy_getCell(1, 0).setValue("03/13/2005 00:00:00");
xlsTable1.easy_getCell(1, 0).setFormat(EasyXLS.Constants.Format.FORMAT_DATE);
xlsTable1.easy_getCell(2, 0).setValue("03/14/2005 00:00:00");
xlsTable1.easy_getCell(2, 0).setFormat(EasyXLS.Constants.Format.FORMAT_DATE);
xlsTable1.easy_getCell(3, 0).setValue("03/15/2005 00:00:00");
xlsTable1.easy_getCell(3, 0).setFormat(EasyXLS.Constants.Format.FORMAT_DATE);
xlsTable1.easy_getCell(4, 0).setValue("03/16/2005 00:00:00");
xlsTable1.easy_getCell(4, 0).setFormat(EasyXLS.Constants.Format.FORMAT_DATE);
xlsTable1.easy_getCell(1, 1).setValue("10000");
xlsTable1.easy_getCell(2, 1).setValue("5000");
xlsTable1.easy_getCell(3, 1).setValue("8500");
xlsTable1.easy_getCell(4, 1).setValue("1000");
xlsTable1.easy_getCell(1, 2).setValue("8000");
xlsTable1.easy_getCell(2, 2).setValue("4000");
xlsTable1.easy_getCell(3, 2).setValue("6000");
xlsTable1.easy_getCell(4, 2).setValue("1000");
xlsTable1.easy_getCell(1, 3).setValue("920");
xlsTable1.easy_getCell(2, 3).setValue("1005");
xlsTable1.easy_getCell(3, 3).setValue("342");
xlsTable1.easy_getCell(4, 3).setValue("967");
// Set column widths
xlsTable1.easy_getColumnAt(0).setWidth(100);
xlsTable1.easy_getColumnAt(1).setWidth(100);
xlsTable1.easy_getColumnAt(2).setWidth(100);
xlsTable1.easy_getColumnAt(3).setWidth(100);
// Add a chart sheet
workbook.easy_addChart("Chart", "=SourceData!$A$1:$D$5", Chart.SERIES_IN_COLUMNS);
// Get the previously added chart
ExcelChart xlsChart = ((ExcelChartSheet)workbook.easy_getSheetAt(1)).easy_getExcelChart();
// Set chart type
xlsChart.easy_setChartType(Chart.CHART_TYPE_CYLINDER_COLUMN);
// Format chart area
ExcelChartArea xlsChartArea = xlsChart.easy_getChartArea();
xlsChartArea.getLineColorFormat().setLineColor(Color.DarkGray);
xlsChartArea.getLineStyleFormat().setDashType(LineStyleFormat.DASH_TYPE_SOLID);
xlsChartArea.getLineStyleFormat().setWidth(0.25f);
// Format chart plot area
ExcelPlotArea xlsPlotArea = xlsChart.easy_getPlotArea();
xlsPlotArea.getLineColorFormat().setLineColor(Color.DarkGray);
xlsPlotArea.getLineStyleFormat().setDashType(LineStyleFormat.DASH_TYPE_SOLID);
xlsPlotArea.getLineStyleFormat().setWidth(0.25f);
// Format chart legend
ExcelChartLegend xlsChartLegend = xlsChart.easy_getLegend();
xlsChartLegend.getFillFormat().setBackground(Color.LavenderBlush);
xlsChartLegend.getFontFormat().setForeground(Color.Blue);
xlsChartLegend.getFontFormat().setItalic(true);
xlsChartLegend.setKeysArrangementDirection(Chart.KEYS_ARRANGEMENT_DIRECTION_HORIZONTAL);
xlsChartLegend.setPlacement(Chart.LEGEND_CORNER);
xlsChartLegend.getShadowFormat().setShadow(ShadowFormat.OFFSET_DIAGONAL_BOTTOM_RIGHT);
// Format chart X axis
ExcelAxis xlsXAxis = xlsChart.easy_getCategoryXAxis();
xlsXAxis.getLineColorFormat().setLineColor(Color.SteelBlue);
xlsXAxis.getLineStyleFormat().setDashType(LineStyleFormat.DASH_TYPE_DASH_DOT);
xlsXAxis.getLineStyleFormat().setWidth(0.25f);
xlsXAxis.getFontFormat().setForeground(Color.Red);
// Format chart Y axis
ExcelAxis xlsYAxis = xlsChart.easy_getValueYAxis();
xlsYAxis.getLineColorFormat().setLineColor(Color.SteelBlue);
xlsYAxis.getLineStyleFormat().setDashType(LineStyleFormat.DASH_TYPE_LONG_DASH);
xlsYAxis.getLineStyleFormat().setWidth(0.25f);
xlsYAxis.getFontFormat().setForeground(Color.Blue);
// Fomat chart series
xlsChart.easy_getSeriesAt(0).getFillFormat().setBackground(Color.RoyalBlue);
xlsChart.easy_getSeriesAt(1).getFillFormat().setBackground(Color.Yellow);
xlsChart.easy_getSeriesAt(2).getFillFormat().setBackground(Color.LightGreen);
// Export Excel file
Console.WriteLine("Writing file C:\\Samples\\Tutorial23 - various Excel chart settings.xlsx.");
workbook.easy_WriteXLSXFile("C:\\Samples\\Tutorial23 - various Excel chart settings.xlsx");
// Confirm export of Excel file
String sError = workbook.easy_getError();
if (sError.Equals(""))
Console.Write("\nFile successfully created. Press Enter to Exit...");
else
Console.Write("\nError encountered: " + sError + "\nPress Enter to Exit...");
// Dispose memory
workbook.Dispose();
Console.ReadLine();
}
}